HOUSTON — February 14, 2019 — Waste Management, Inc. today announced financial results for its quarter ended December 31, 2018. Revenues for the fourth quarter of 2018 were $3.84 billion, compared with $3.65 billion for the same 2017 period. Net income for the quarter was $531 million, or $1.24 per diluted share, compared with net income of $903 million, or $2.06 per diluted share, for the fourth quarter of 2017.(a) On an adjusted basis, earnings per diluted share were $1.13 for the fourth quarter of 2018, compared with $0.85 for the fourth quarter of 2017.(b)
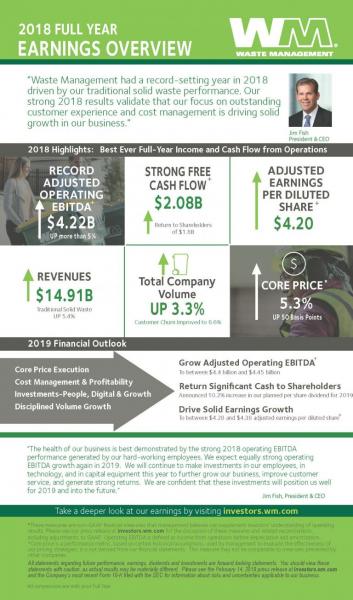
For the full year 2018, the Company reported revenues of $14.91 billion, compared with $14.49 billion for 2017. Earnings per diluted share were $4.45 for the full year 2018 compared with $4.41 for the full year 2017. On an adjusted basis, earnings per diluted share were $4.20 for the full year 2018 versus $3.22 for the full year 2017.(b)
Jim Fish, President and Chief Executive Officer of Waste Management, commented, “2018 was a record-setting year for Waste Management, driven by our traditional solid waste performance. We grew operating EBITDA by more than 5%, which led to an increase in net cash provided by operations of more than 12% to $3.57 billion.(c) This growth translated into free cash flow of over $2 billion and the most cash returned to our shareholders in over a decade.(b) Our strong 2018 results validate that our focus on outstanding customer experience and cost management drives solid growth in our business.”
KEY HIGHLIGHTS FOR THE FOURTH QUARTER AND THE FULL YEAR 2018
Profitability
- Operating EBITDA was $1.14 billion for the fourth quarter of 2018 and $4.27 billion for the full year. Adjusted operating EBITDA was $1.09 billion for the fourth quarter of 2018 and $4.22 billion for the full year. On a year-over-year basis, adjusted operating EBITDA grew $73 million, or 7.2%, in the fourth quarter and $210 million, or 5.2%, for the year. Adjusted operating EBITDA margin improved 50 basis points in the fourth quarter and 60 basis points for the full year.(b)
Revenue Growth
- In the fourth quarter, revenue growth was driven by strong yield and volume growth in the Company’s collection and disposal business, which contributed $203 million of incremental revenue on a year-over-year basis. Revenue from the Company’s recycling business increased $18 million in the fourth quarter of 2018. For the full year, yield and volume growth in the Company’s collection and disposal business contributed $693 million of incremental revenue. This was partially offset by a decline in revenue from the Company’s recycling business, which fell by $197 million year-over-year, due to lower market prices for commodities net of contamination fees.
- Core price was 5.6% in the fourth quarter of 2018, compared to 4.8% in the fourth quarter of 2017. For the full year, core price was 5.3%, compared to 4.8% in 2017. (d)
- Internal revenue growth from yield for collection and disposal operations was 2.3% for both the fourth quarter and the full year, compared with 2.2% in the fourth quarter of 2017 and 2.0% for the full year 2017.
- Traditional solid waste internal revenue growth from volume was 3.1% in the fourth quarter of 2018, or 2.4% on a workday-adjusted basis. Total Company internal revenue growth from volume, which includes recycling and other businesses, was 4.7% in the fourth quarter, or 4.0% on a workday adjusted basis. For the full year 2018, traditional solid waste internal revenue growth from volume was 9% and total Company volume was 3.3%.
Recycling
- Operating EBITDA in the Company’s recycling line of business improved modestly when comparing the fourth quarter of 2018 with the prior year period as the Company executed on its contamination fee strategy. For the full year, operating EBITDA in the Company’s recycling line of business declined nearly $90 million when compared to the full year 2017.
Cost Management
- The Company focused on managing SG&A to reduce costs as a percentage of revenue to below 10% for the first time since 2005. As a percent of revenue, SG&A expenses were 9.6% in the fourth quarter of 2018, compared to 10.1% in the fourth quarter of 2017. For the full year, as a percentage of revenue, SG&A expenses were 9.7%, compared to 10.1% for the full year 2017.
Free Cash Flow & Capital Allocation
- Net cash provided by operating activities was $912 million in the fourth quarter compared to $792 million in the fourth quarter of 2017. For the full year, net cash provided by operating activities was $3.57 billion, compared to $3.18 billion for the full year of 2017. The increase in operating cash flow for the quarter and the year reflects the benefits of strong operating income growth and lower cash taxes, which were partially offset by the payment of approximately $65 million in bonuses to the Company’s hard-working front-line employees.
- Capital expenditures were $454 million in the fourth quarter, compared to $528 million in the fourth quarter of For the full year, capital expenditures were $1.69 billion, compared to $1.51 billion for the full year of 2017. The year-over-year increase was in line with expectations as the Company invested a significant portion of its tax savings in facility improvements, natural gas fueling infrastructure and expanding its natural gas fleet.
- Free cash flow was $560 million, including $102 million in asset sales, in the fourth quarter, compared to $344 million, including $80 million in asset sales, in the fourth quarter of 2017. For the full year, free cash flow was $2.08 billion, including $208 million in asset sales, compared to $1.77 billion, including $99 million in asset sales, for the full year of 2017.(b)
- The Company returned $451 million to shareholders in the fourth quarter comprised of $197 million in dividends and $254 million in share repurchases. For the full year, the Company returned $1.8 billion to shareholders comprised of $802 million in dividends and $1.0 billion in share repurchases.
- The Company spent $466 million on acquisitions of solid waste businesses during 2018, $118 million of which was spent in the fourth quarter.
Income Taxes
- The Company’s effective tax rate for the fourth quarter of 2018 was 19.3%. On an adjusted basis, the tax rate was 21.5%. For the full year, the Company’s effective tax rate was 19.0%. On an adjusted basis, the tax rate was 22.1%.(b)
2019 OUTLOOK
The Company announced the following regarding its financial outlook for 2019:
Profitability
- Adjusted operating EBITDA is expected to grow $185 to $235 million to between $4.40 and $4.45 billion for the full year. (b)
- Adjusted earnings per diluted share for 2019 is expected to be between $4.28 and $4.38.(b)
Revenue Growth
- Core price is expected to be greater than 4.0% for 2019. Internal revenue growth from yield on the collection and disposal business is expected to be greater than 2.0%.
- Internal revenue growth from volume is expected to be around 2.0%.
Free Cash Flow & Capital Allocation
- Free cash flow for 2019 is projected to be between $2.025 and $2.075 billion. (b)
- Capital expenditures are expected to be in the range of $1.65 to $1.75 billion, with proceeds from asset sales projected to be $50 to $100 million.
- The Board of Directors has indicated its intention to increase the dividend by $0.19, or 2%, to $2.05 per share on an annual basis, for an approximate annual cost of $870 million. The Board must separately approve and declare each dividend.
- The Board of Directors has authorized management to repurchase up to $1.5 billion of the Company’s common stock. This authorization is not limited to 2019 and does not expire.
Income Taxes
- The Company expects its full year adjusted effective tax rate to be approximately 24.0%.(b)
Fish concluded, “The health of our business is best demonstrated by the strong 2018 operating EBITDA performance generated by our hard-working employees. We expect equally strong operating EBITDA growth again in 2019. We will continue to make investments in our employees, in technology, and in capital equipment this year to further grow our business, improve customer service, and generate strong returns. We are confident that these investments will position us well for 2019 and into the future.”
————————————————————————————————————–
(a) For purposes of this press release, all references to “Net income” refer to the financial statement line items “Net income attributable to Waste Management, Inc. ”
(b)Adjusted earnings per diluted share, adjusted net income, adjusted operating EBITDA, adjusted operating EBITDA margin, adjusted tax rate, and free cash flow are non-GAAP measures. Please see “Non-GAAP Financial Measures” below and the reconciliations in the accompanying schedules for more information.
(c)Management defines operating EBITDA as GAAP income from operations before depreciation and amortization; this measure may not be comparable to similarly-titled measures reported by other companies.
(d)Core price is a performance metric used by management to evaluate the effectiveness of our pricing strategies; it is not derived from our financial statements and may not be comparable to measures presented by other companies. Core price is based on certain historical assumptions, which may differ from actual results, to allow for comparability between reporting periods and to reveal trends in results over time.
The Company will host a conference call at 10:00 AM (Eastern) February 14, 2019 to discuss the fourth quarter and full year 2018 results. Information contained within this press release will be referenced and should be considered in conjunction with the call.
The conference call will be webcast live from the “Events & Presentations” section of investors.wm.com. To access the conference call by telephone, please dial (877) 710-6139 approximately 10 minutes prior to the scheduled start of the call. If you are calling from outside of the United States or Canada, please dial (706) 643-7398. Please utilize conference ID number 6496795 when prompted by the conference call operator.
A replay of the conference call will be available on the Company’s website investors.wm.com and by telephone from approximately 1:00 PM (Eastern)February 14, 2019 through 5:00 PM (Eastern) on February 28, 2019. To access the replay telephonically, please dial (855) 859-2056, or from outside of the United States or Canada, dial (404) 537- 3406 and use the replay conference ID number 6496795.
ABOUT WASTE MANAGEMENT
Waste Management, based in Houston, Texas, is the leading provider of comprehensive waste management environmental services in North America. Through its subsidiaries, the Company provides collection, transfer, disposal services, and recycling and resource recovery. It is also a leading developer, operator and owner of landfill gas-to-energy facilities in the United States. The Company’s customers include residential, commercial, industrial, and municipal customers throughout North America. To learn more information about Waste Management, visit www.wm.com or www.thinkgreen.com.
FORWARD-LOOKING STATEMENTS
The Company, from time to time, provides estimates of financial and other data, comments on expectations relating to future periods and makes statements of opinion, view or belief about current and future events. This press release contains a number of such forward-looking statements, including but not limited to all statements under the heading “2019 OUTLOOK” and all statements about future business performance, growth, investments and returns. You should view these statements with caution. They are based on the facts and circumstances known to the Company as of the date the statements are made. These forward-looking statements are subject to risks and uncertainties that could cause actual results to be materially different from those set forth in such forward-looking statements, including but not limited to, increased competition; pricing actions; failure to implement our optimization, growth, and cost savings initiatives and overall business strategy; failure to identify acquisition targets and negotiate attractive terms; failure to consummate or integrate such acquisitions; failure to obtain the results anticipated from acquisitions; environmental and other regulations; commodity price fluctuations; international trade restrictions and tariffs; disposal alternatives and waste diversion; declining waste volumes; failure to develop and protect new technology; significant environmental or other incidents resulting in liabilities and brand damage; weakness in economic conditions; failure to obtain and maintain necessary permits; technology failures or cybersecurity incidents; labor disruptions; impairment charges; and negative outcomes of litigation or governmental proceedings. Please also see the Company’s filings with the SEC, including Part I, Item 1A of the Company’s most recently filed Annual Report on Form 10-K, for additional information regarding these and other risks and uncertainties applicable to our business. The Company assumes no obligation to update any forward-looking statement, including financial estimates and forecasts, whether as a result of future events, circumstances or developments or otherwise.
NON-GAAP FINANCIAL MEASURES
To supplement its financial information, the Company, in some instances, has presented adjusted earnings per diluted share, adjusted net income, adjusted operating EBITDA, adjusted operating EBITDA margin, adjusted tax rate and free cash flow, and has also provided projections of adjusted earnings per diluted share, adjusted operating EBITDA, adjusted tax rate, and free cash flow; these are non-GAAP financial measures, as defined in Regulation G of the Securities Exchange Act of 1934, as amended.
The Company reports its financial results in compliance with GAAP but believes that also discussing non-GAAP measures provides investors with (i) additional, meaningful comparisons of current results to prior periods’ results by excluding items that the Company does not believe reflect its fundamental business performance and are not representative or indicative of its results of operations and (ii) financial measures the Company uses in the management of its business.
The Company’s projected full year 2019 adjusted earnings per diluted share, adjusted operating EBITDA and adjusted tax rate are anticipated to exclude the effects of events or circumstances in 2019 that are not representative or indicative of the Company’s results of operations. Such excluded items are not currently determinable, but may be significant, such as asset impairments and one-time items, charges, gains or losses from divestitures or litigation, or other items. Due to the uncertainty of the likelihood, amount and timing of any such items, the Company does not have information available to provide a quantitative reconciliation of adjusted projected full-year earnings per diluted share, operating EBITDA or tax rate to the comparable GAAP measures.
The Company discusses free cash flow because the Company believes that it is indicative of its ability to pay its quarterly dividends, repurchase common stock, fund acquisitions and other investments and, in the absence of refinancings, to repay its debt obligations. Free cash flow is not intended to replace “Net cash provided by operating activities,” which is the most comparable GAAP measure. The Company believes free cash flow gives investors useful insight into how the Company views its liquidity, but the use of free cash flow as a liquidity measure has material limitations because it excludes certain expenditures that are required or that the Company has committed to, such as declared dividend payments and debt service requirements. The Company defines free cash flow as net cash provided by operating activities, less capital expenditures, plus proceeds from divestitures of businesses and other assets (net of cash divested); this definition may not be comparable to similarly-titled measures reported by other companies.
The quantitative reconciliations of non-GAAP measures used herein to the most comparable GAAP measures are included in the accompanying schedules, with the exception of projected earnings per diluted share, operating EBITDA and tax rate. Non-GAAP measures should not be considered a substitute for financial measures presented in accordance with GAAP.
FOR MORE INFORMATION:
Web site www.wm.com
Analysts
Ed Egl 713.265.1656
eegl@wm.com
Media
Tiffiany Moehring 720.346.5372
tmoehrin@wm.com
- SHARE:


